The Sharp Edges of Monitoring Solutions
Usage vs Volume Rates
There are many high-quality and comprehensive monitoring solutions which bill by usage, as opposed to volume. I have also heard of this being described as “on-demand”. This billing tactic is commonplace in the cloud service provider industry. From my perspective, the risks often outweigh the rewards when it comes to nice solutions that employ this billing tactic.

Figure 1 – Volcanic Glass
Not too long ago I encountered a situation where a misconfiguration of the log collector agent for a popular monitoring solution caused the log collector agent to generate about fifty million logs per hour, leading to an eight fold increase in rate based spend. Mercifully, the provider reached out, but not before nearly half the yearly spending commitment had been burned on this error.
Depending on the provider it may be very challenging to recoup the costs of this mishap, if it is possible at all. Imagine burning your runway on an errant configuration of the very application supplied by your monitoring provider to ship metrics to your provider. It is not a nice thought and I have witnessed the implications firsthand. A potentially startup killing mistake. The monitoring landscape is a minefield of usage based products. Consider this, does your provider bill by the gigabyte of logs indexed, or the number of log lines indexed? The difference is critical.
A Nickel Here and a Dime There
One of my greatest frustrations with some monitoring products is the tendency for these providers to nickel and dime for every last little thing. Autoscaling a container? Pay per container for container stats and pay more in rate based billing units for logs. Add APM? New billing dimension.
Lots of Heavy Lifting and Lots of Lock-In
I rarely find that fancy and expensive monitoring solutions are turnkey. Between building dashboards and configuring log and metric agents it’s hardly less work than rolling your own solution. However, thanks to all of your efforts to integrate with this vendor, you are now locked into their platform and you shudder to think about the effort of going somewhere else.
Just learning a provider’s query language can be a huge investment of time. For example, Splunk has a video training program that takes about ten solid working days to complete. I was once required to complete it for a contract role at a large shoe company. Absolute nightmare. Of course anything complex will take time to learn. My gripe is investing time to learn something that is only useful inside of the vendor’s walled garden.
The Alternatives
ELK/EFK
The Elasticsearch stack is a tried and true monitoring solution that is very comprehensive. It scales horizontally and can scale automatically (depending on provider and solution). I have used this stack in the past and found it to be robust and mostly trouble free. However, I have may gripes about this stack. Operating an Elasticsearch cluster requires a great deal of specialized knowledge. For example, I found setting up Prometheus metrics collection in Elastic to not be nearly as easy as it was billed to be in Elastic Co’s marketing material. Beyond that, Kibana is dreadfully slow thanks to its bloated frontend. I recall opening the inspector and watching 60mb of javascript files download between page loads.
The Stack
- Elasticsearch: A venerable data ingest and indexing engine that is scalable and tunable. Elasticsearch is based on the Lucene full text search engine. There are many ways to use Elasticsearch, including monitoring.
- Filebeat, Fluentd or Logstash: These tools ship log data to Elasticsearch.
- Kibana: The visualization and administration layer for Elasicsearch.
Pros:
- Good out of the box solution for APM and logging.
- Filebeat is very simple to setup as a Kubernetes DaemonSet.
- It is easy to make dashboards in Kibana without writing any code and without knowing much about the query language.
- Managing costs is straightforward.
- Optimized for indexes with clear rolloff policies.
Cons:
- Not well integrated with Kubernetes. For example, I found collecting Prometheus metrics with Elasticsearch to be difficult to do efficiently.
- The most practical way to deploy this stack is to use a provider like Elastic Cloud or “OpenSearch”, however, there are Kubernetes operators available.
- Slow UI (in my opinion).
My Experience with ELK/EFK
I have gone back and forth as to whether or not to discuss the ELK stack in this article. I have used it in the past and generally found it to be satisfactory. The question is, do I recommend it? I see this stack as supplemental, and not my first choice. There are easier stacks to deploy that can later be extended by this stack. Perhaps my biggest gripe with this stack is that I have often found that questions related to Elasticsearch whither and die on the Elastic community forum.
Kube Native Monitoring Stack
There may be another name for this stack and I am mostly making up the name. It is a combination of CNCF projects and Grafana projects that can be self-hosted in a Kubernetes first fashion. I call it Kubernetes Native Monitoring because everything in the stack has significant adjacency and conformance to how applications are deployed to Kubernetes.
The Stack
- Prometheus: Practically everything designed to deploy in Kubernetes exposes Prometheus metrics. It is so broadly utilized that it does not make sense to ignore. Additionally, Prometheus has an extensive monitoring ecosystem that can operate in any *nix environment such as
node_exporterandblackbox_exporter.- Prometheus Alert Manager is capable of sending alerts to a variety of incident management solutions.
- Prometheus Pushgateway covers the use-case of short lived jobs which do not conform to Prometheus’s scrape based metrics collection architecture.
- Prometheus Alertmanager can send alerts generated by Prometheus to popular paging solutions like Pagerduty and OpsGenie.
- Cortex: This is a longterm storage solution for Prometheus metrics. Prometheus generally retains data for days or weeks, depending on volume. Prometheus data can be replicated to Cortex for long term retention.
- OpenTelemetry: An alternative to vendor-specific APM solutions.
- Loki: Log collection inspired by Prometheus. Loki indexes metadata rather than the contents of the log itself and has a query language similar to PromQL for Prometheus.
- Grafana: This is the tool that ties everything else together. It is possible to visualize the data generated by all of the above with Grafana. In many cases there are ready made dashboards available for common usecases like ingress monitoring.
Pros:
- Kubernetes native deployment philosophy. Components can be installed via helm and have readily available charts.
- Query logs and metrics with similar query languages.
- Everything can be viewed under a unified interface (Grafana).
- Extensible with many out of the box solutions.
- Developers using your platform can incrementally adopt the solution while still benefiting from out of the box dashboards for basic container metrics.
Cons:
- You are completely on your own when it comes to making everything work and keep working.
- Loki might not satisfy your use-case for analyzing logs because Loki only indexes the metadata, not the log message.
- You will have to demonstrate compliance with various compliance frameworks if that is important to your business.
- Grafana is not immune to licensing disputes. During the course of configuring Linkerd I discovered that Linkerd Viz no longer shipped with Grafana due to a licensing change.
What Kubernetes Native Monitoring Looks Like
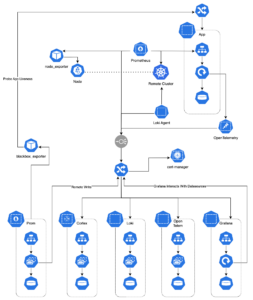
Figure 2 – Monitoring Data Flow
Monitoring data flows out of the environment being monitored into the monitoring cluster. Each of the tools I discuss in this section lend themselves to this type of data-flow. This is one of the more difficult bridges to cross as securing each monitoring service becomes very important. This is a simple enough stack that ingress-nginx (not to be confused with F5’s proprietary nginx-ingress) will take care of this need. The ingress-nginx ingress controller supports a number of authentication methods including OAUTH. These features should address the ingest side of the data-flow. As far as user access to data, Grafana is fully featured.
There are a couple of options when it comes to how this stack is managed. For the most part each component can be rigidly defined. IaC via helm charts readily available for these components are likely adequate. There is a case to be made that your monitoring solution should also be strictly IaC. I generally agree with this, however, I think it is important to offer some way to create new dashboards in Grafana. The simplest form of this involves a SQLite database and a persistent volume. Offer this feature in a sandbox environment and allow users to promote useful dashboards to the production environment via IaC.
Figure 2 shows a potential implementation of the Kubernetes native monitoring stack where each component exists independently and is tied together via Grafana. OpenTelemetry, Prometheus and Loki remotely write metrics to the monitoring cluster. By centralizing monitoring data collection to a single cluster it is easy to bring new environments online and aggregate the metrics from each environment in a single place. Note that figure 2 does not explicitly call out which OpenTelemetry collector to use, however, any collector such as Tempo by Grafana Labs will work.
My Experience with Kubernetes Native Monitoring
I have created several variants of this monitoring pattern over the last couple of years. The single best piece of advice I can offer to get started quickly is to use Helm to install each of the components you’d like to have. Helm used to get a bad rap before V3 because of Tiller. Today there is no Tiller requirement for Helm. Helm plays nicely with many automation tools like ArgoCD and Terraform. The best part is that the Kube Prometheus Stack helm chart will cover most of your needs out of the box.
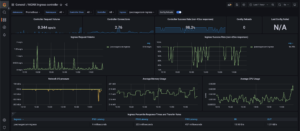
Figure 3 – Ingress-Nginx Dashboard for joecreager.com
Today, I use portions of this pattern to monitor my own website. In fact, you can borrow my Terragrunt modules to get started on your own monitoring cluster. Many of the components described here are available in that repository as modules that can be consumed by Terragrunt. If you don’t like Terragrunt, you can still see how I am configuring the Helm charts in each module.
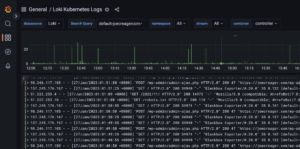
Figure 4 – Loki Logs
I recommend my article on mulit-environment GitOps to get an idea about how to automate creating multiple Kubernetes environments with ArgoCD. The concepts in that article can be leveraged to create multiple identical clusters monitored the same way. I think the GitOps pattern with ArgoCD is preferable for situations where there will be many contributors creating resources across multiple environments.
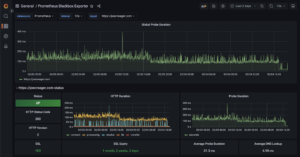
Figure 5 – Page load times for joecreager.com
Figure 5 is a glimpse into the utility of Kubernetes native monitoring. I had long suspected that the popular Jetpack plugin for WordPress was bloated. I decided to rip this hefty plugin out of my deployment for this website. Thanks to my continuous monitoring via blackbox_exporter I was able to capture the reduction in page load times due to this change. Notice another precipitous drop in response time towards the end of the chart after page caching features were enabled.
When and Why I Advocate for Kubernetes Native Monitoring
Kubernetes native monitoring makes the most sense for organizations that are already invested in Kubernetes and have at least two or three in house experts. I selected that number because if there is only a single individual carrying the torch a Kubernetes monitoring effort is not likely to succeed longer than that individuals tenure. This is especially true if there is no pre-existing investment in Kubernetes within the organization. I have no data to back this up. Just experience.
On the other hand, if your organization is planning to invest in Kubernetes I think monitoring is a great place to start. It is low risk and the Kubernetes native monitoring stack can be integrated with non-Kubernetes deployments such as traditional VMs. That said, the best time to consider making this investment is when your organization is already invested in Kubernetes and has a reasonable in-house complement of Kubernetes subject matter experts.
Predictable costs are essential for startups. Rate based products are a major financial footgun that is best absorbed by large companies where a mistake in a rate based billing product will only be a blip on the quarterly books. Ask yourself this, what emotions would you experience if a mistake with a rate based product wound up costing you half of an engineer’s yearly salary? If the answer is anything other than indifference your organization probably is not in a place to deal with that kind of risk.
Another important aspect of Kubernetes native monitoring is inter-project synergies. For example, Loki is inspired by Prometheus, and has a similar query syntax. Many of these tools were created with Kubernetes in mind from the start or have been adapted to Kubernetes very effectively. If you want the best monitoring experience for Kubernetes it makes sense to choose tools made to provide exactly that.
Conclusion
There are a lot of great monitoring solutions out there. My focus is on Kubernetes and I think it makes sense to choose a Kubernetes native solution to monitoring Kubernetes. I have tried my best in this article to dispel the notion that fancy usage based monitoring solutions are less of an “easy button” than one might expect. Kubernetes native monitoring is a viable, cost effective, and less cost-volatile than solutions that bill by usage. At a certain point, it will become undesirable for an organization’s monitoring costs to scale linearly with the number of services it needs to monitor. The efficiencies of Kubernetes native monitoring help solve this problem because monitoring costs will be based on volume in terms of compute resources. While there is no doubt that Kubernetes monitoring requires effort, I hope my writing on this subject, and the CNCF ecosystem showcase the practicality and possibilities of Kubernetes native monitoring.